


table of contents
stay up to Date about neospectra
Introduction
Polymers are used in our everyday life, but the increasing negative effects of polymer waste have forced governmental authorities to take legal measures for environmental protection. Thus, for the sustainable utilization of raw materials in some countries it is already required by legislation that a certain percentage of the most frequently occurring polymer waste is recycled with the primary focus on separation and reuse of the polymer commodities.
Overview
identification routine has to be economical, fast, and easy to operate. Based on the well known potential of NIR spectroscopy for polymer analysis this technique has been identified as a useful tool for this process. The NIR wavelength range is dominated by overtone and combination bands of C-H, N-H, O-H and, less significantly, C=O functionalities. Therefore, the NIR spectroscopic separation of the specified polymer commodities is primarily based on the first and second overtones and the combination bands of these functionalities. In view of the steadily increasing amount of plastic waste, the introduction of miniaturized & low cost NIR spectrometers for non-expert use could greatly improve the extent and rate of polymer recycling additionally to the efforts of recycling plants. The on-site separation of the large amounts of plastic waste incurred in the form of packaging materials, cups, containers and construction material at expositions, trade fairs and other large events as well as in many locations of public life may serve as an example here.
Classifying Different Types of Polymers
In order to demonstrate the ability of the NeoSpectra spectral sensors to discriminate the different types of polymer commodities. we show how it is used to perform discrimination of 5 different polymers commodities: polyethylene (PE), polypropylene (PP), polyethylene terephthalate (PET), and polyvinyl chloride (PVC).
Sample Sets
o While carbon-black filled samples were excluded from measurement polymers with small amounts of additives, pigments or dyes were recorded without significant impact on their NIR spectra.
o Total 43 samples: 29 calibration samples, 14 test samples
o Samples and spectra were recorded in triplicate
Measurement Conditions
o Wavelength range: 1298 - 2606 nm
o Scan time: 16s
o Resolution: 8nm at λ=1,550 nm
Some standard and simple data treatment processes were performed on measure spectra:
o For each sample, the triplicate spectra sample were averaged.
o The wavelength scale was converted into wave numbers and the 7504 – 4001 cm-1 Spectra were pretreated by a 2nd derivative with a Savitzky Golay smoothing procedure of 5 data points and a 2nd order polynomial.
o Standard normal variate (SNV) procedure was applied to correct for scattering effects.
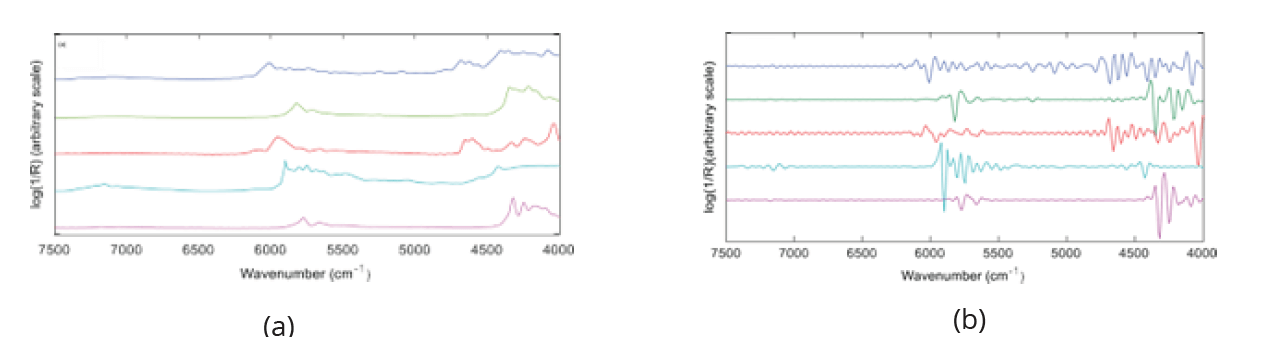
in Figure 1 the NIR spectra of exemplary representative of the five polymer commodities are shown before (a) and after (b) spectral pretreatment.
Data Evaluation
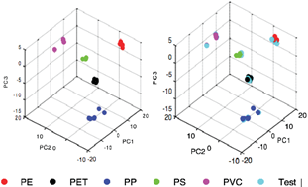
PCA (principal component analysis) models were developed with the spectra of the calibration samples of all five polymer commodities and their identification performance was verified with the spectra of the test set samples. After application of the PCA, the number of PCs is lower than the original variables. This reduction of PCs allows patterns in the data to be easily visualized and analyzed. In Figure 2 the PCA score plots based on the first 3 PCs are shown for the calibration samples (a) of the five polymer commodities PE, PET, PP, PS and PVC. Figure 2 (b) shows the same score plot including the test samples (cyan symbols). Thus, the five polymers can be clearly discriminated in the score plots and test samples are correctly assigned to their respective cluster.
SIMCA (soft independent modeling of class analogies) analysis was used to test the iden- tification capability for the spectra of the test set polymers. SIMCA is a classification method analyzing similarities by using the PCA models developed for the spectra of different classes to assess to which class an unknown sample belongs to. The classifica- tion results are represented in so called Coomans plots and in the present case poly- mer identity can be achieved if the spectra of the test samples are assigned to the relevant quadrant defined by the SIMCA model. Exemplarily for all possible polymer pairs the Coomans plot (5% significance) representing the discrimination of PE and PET is shown in Figure 3.
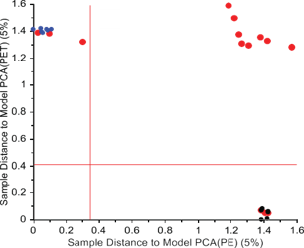
While the blue and black dots represent PE and PET calibration spectra, respectively, the red dots belong to the spectra of polymer test samples of all five identities. Of these test samples the PE and PET polymers were correctly assigned to the corresponding quadrants whereas the spectra of the other polymer species ended up in the upper right quadrant indicating that these are other polymer classes. In analogy the SIMCA analy- sis of the other polymer pairs correctly assigned the test samples to their respective identity.
Conclusions
The investigations clearly demonstrate that the spectra of the most common polymer commodities (PP, PET, PE, PS and PVC) measured with NeoSpectra spectral sensor provide suitable analytical data for the correct identification of unknown polymer test samples. This validates the potential of this technology to enable fast, in-site, non-destructive, low cost, and scalable solution for plastic sorting without the need to make any preparation process for samples. In a first step the PCA applied to the calibration spectra of all polymer classes yielded a clear separation of the different polymers into clusters and the spectra of test samples were correctly identified. Furthermore, the SIMCA analyses based on the PCAs of all possible polymer pairs provided a perfect identification of test sample spectra to the correct polymer.

