


table of contents
stay up to Date about neospectra
Introduction
Soil is one of the largest repositories of carbon in our world, and the soil’s capacity to store carbon is even greater than that of vegetation and the atmosphere. At the same time, organic carbon is the key to soil health and resilience. Soil carbon plays a key role in supplying macro and micro-nutrients to plants, and can even help stabilize the soil against mechanical impact, offering protection against extreme climate events.
Overview
Recognizing this fact, the 4 per 1000 initiative launched at the Lima-Paris Action Agenda set forth a goal to increase global stocks of soil organic matter by 0.4% per year to compensate for human-caused emissions of greenhouse gases. But a crucial element in this plan is the ability to accurately estimate the size of the soil carbon pool. To understand and map the distribution of soil carbon stock requires rapid, accurate, and cost-effective means of measurement that can be deployed in the field.
While near-infrared (NIR) technology has become an important tool in soil carbon research, research-grade NIR spectrometers cost from $40,000 to $60,000, and sending samples to a lab means days or weeks before receiving data. In contrast, the NeoSpectra sensor, when integrated into a wireless handheld device, offers the opportunity to instantly analyze samples in the field, saving time.
The NeoSpectra scanner is placed on a soil sample, relays the spectral signature and quantification data to a mobile phone, which sends it to the cloud, where the spectral signatures are compared in a database and the data analyzed in real time. The results are sent immediately back to the phone where the data can be displayed in an app.
Soil Carbon Prediction Accuracy Studies
Researchers at the University of Sydney used a handheld NIR scanner incorporating the NeoSpectra sensor to test the prediction of soil properties in Australia on 392 samples, with a view to determining its usefulness for field studies on soil carbon. In one study, researchers evaluated the NeoSpectra sensor against two research grade visible-NIR (Vis-NIR) spectrometers. The study also evaluated prediction of other properties including pH, cation exchange capacity (CEC), exchangeable calcium (Ca) and magnesium (Mg). The NeoSpectra sensor operates at 1250-2500 nm, while the fuller range spectrometers operate at 350-2500nm. The spectra collected from the different spectrometers are show in Figure (1).
In a second study, 151 diverse soil samples were collected from agricultural areas across New South Wales to test prediction by Vis-NIR and the NeoSpectra sensor for total carbon. A subset of 24 samples was used to test predictions for inorganic carbon.
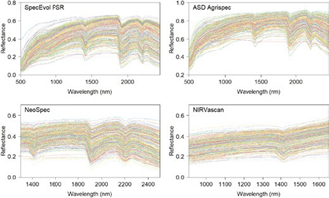
instruments after trimming to remove regions with low signal to noise ratio.
Development of Analysis Model and Results
Both studies built multiple calibration models using Cubist tree and partial least squares regression (PLSR) approaches. The researchers used the Savitsky-Golay smoothing filter and standard normal variate transformation on the spectral data for noise reduction and baseline correction. Then they performed a 10-fold cross-validation analysis to evaluate the accuracy of the models and devices. They found that the Cubist model provided the greatest R2 values for ten soil properties investigated for all instruments. The prediction errors in the validation set of the different instruments are shown in Figure (2).
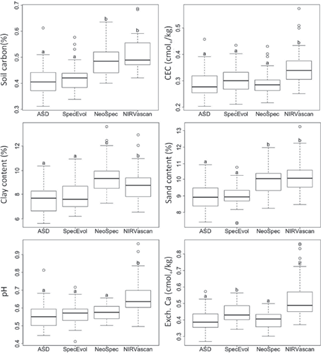
realizations for clay, sand, pH (1:5 CaCl2), total carbon, CEC.
In order to understand how the different spectral ranges affect the Cubist models for each soil property, Figure (3) depicts the weight of the importance of the wavelength for the construction of the model with different instruments for each property.
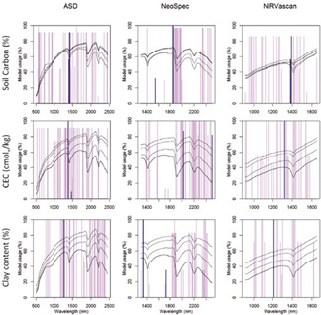
Vascan of the study (scaled for illustration). Vertical blue and purple lines indicate the relative proportion of model usage of wavelengths for the 50 Cubist regression models constructed for each property (blue lines indicate
wavelength used as conditions, purple lines indicate
wavelengths used as predictors in the Cubist models).
Conclusions
The teams found that for the first study, NeoSpectra sensor offers performance that is comparable to research grade spectrometers in the prediction of soil pH, CEC, exchangeable calcium, and magnesium (R2>0.63–0.78). While performance may be slightly lower in this particular study, the huge difference in cost and size, makes NeoSpectra sensors an excellent choice for enabling
in-field soil analysis.
For the second study, the modeling using cross validation showed that the NeoSpectra sensor can predict organic carbon with an accuracy of R2 = 0.78. For total carbon, it was able to predict with an accuracy of R2 = 0.70. The team determined that the NeoSpectra sensor results were comparable to those of the high-end device, and that the removal of the spectral ranges below 1,350 nm did not have significant impact on the accuracy of the prediction in this application. The team also determined that wavelength ranges above 1,800 nm were very important for generating analysis models with good accuracy. This proves that the wide NIR spectral range offered by the NeoSpectra sensor, makes it the best candidate for enabling the lowest cost, in-field soil analyzer with limited loss in accuracy of results.
Acknowledgment
Si-Ware would like to acknowledge and thank Yijia Tang, Edward Jones, and Budiman Minasny, School of Life and Environmental Sciences, The University of Sydney, Sydney, Australia.

