


table of contents
stay up to Date about neospectra
Introduction
Milk is one of the most widely used food products and serves as the raw material for all dairy products. Consequently, milk testing to measure the components of milk has become highly crucial for the dairy industry. Different dairy products necessitate varying ratios of milk contents. Furthermore, regular milk testing of its components is essential to monitor and maintain product quality.
Fast and accurate analysis across different stages of the supply chain of milk products can play a major role in improving efficiencies and quality of milk and milk-based products from farm to fork. This requires a reliable and easy-to-use tool to enable performing this kind of milk testing in various locations.
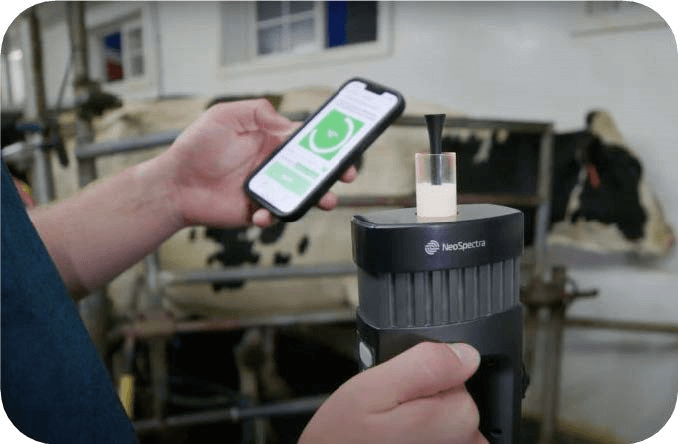
In this application note, we demonstrate the ability of NeoSpectra handheld NIR spectrometer to provide accurate analysis of fat, lactose, and protein content of milk samples with performance that aligns with the ICAR standards.
Overview
In addition to impacting the dairy sector, milk analysis plays a crucial role in the broader milk farming industry. The composition of milk closely correlates with the animal's health and the quality of its feed. Consequently, these analyses offer valuable insights to optimize feed quality, make informed choices, and facilitate early detection and treatment of illnesses in animals.
Presently, the most precise methods for milk analysis involve slow and destructive chemical decomposition, necessitating lab work rather than on-field applications. Typically, users extract samples from multiple milk batches, obtaining averaged conclusions for all batches.
used for on-site analysis of raw milk.
Monitoring animal health and feed quality using these methods proves to be prohibitively expensive and inefficient. Alternatively, FT-IR bench-top systems are available to develop this work, but its cost and high maintenance requirements make them not suitable for on-farm analysis.
A straightforward solution lies in the development of a portable, affordable tool for swift milk content measurement. This tool should enable non-destructive analysis in the field, preferably at line at milking stations for milk farming applications.
Advances in miniaturized Near Infrared (NIR) spectrometers have reached a stage where handheld devices can offer reliable and cost-effective means to address these challenges. This application note showcases the use of NeoSpectra spectral sensors for on-field milk analysis.
How NIR Works
NIR is a secondary analytical method that relies on the data coming from the reference laboratory, reference data, to build PLS regression with the spectra. Once it is calibrated, the PLS model enables predicting milk components using only the spectra generated by the NIR spectrometer. Results can then be obtained in seconds by the instrument.
Experiment Design
In order to demonstrate the ability of NeoSpectra Scanner to predict fat, protein and lactose components of raw milk, the following experimentation was conducted.
Sample Sets
In order to emulate real life situations, the samples used in the experiment need to take into consideration different possible variations of milk samples. Therefore, raw milk samples were collected from different farms, where each sample was collected from a different animal.
Reference Methods
Accurate destructive chemical tests were performed on the samples to record accurately their contents.
Calibration and Validation
To fairly compare the performance of the models, 90% of the samples were used to calibrate the models, while the 10% of the samples were used as unseen sample to test the prediction capability of the models.
Measurement Conditions
• Setup: Diffuse reflection
• Spectral range: 1350 – 2550 nm
• Scan time: of 5s
• Resolution of 16nm at λ=1,550 nm
• Spot size = 10 mm2
• Temperature: Room temperature
• Averaging: Each sample was measured 3 times with the NeoSpectra Scanner and averaged for the analysis.
Calibration Model Development
Partial least squares regression (PLS) models were constructed to establish a linear relationship between the spectra and measurements of milk contents, determined through laboratory chemical analysis. PLS is employed to reduce spectrum data, originally comprising 257 variables (wavelengths), into a limited number of latent variables (L.V.). This reduction in complexity aims to enhance the interpretability of the data.
The selection of latent variables is based on their correlation with the responses (milk contents in this context), prioritizing those with high correlation.
Data analysis
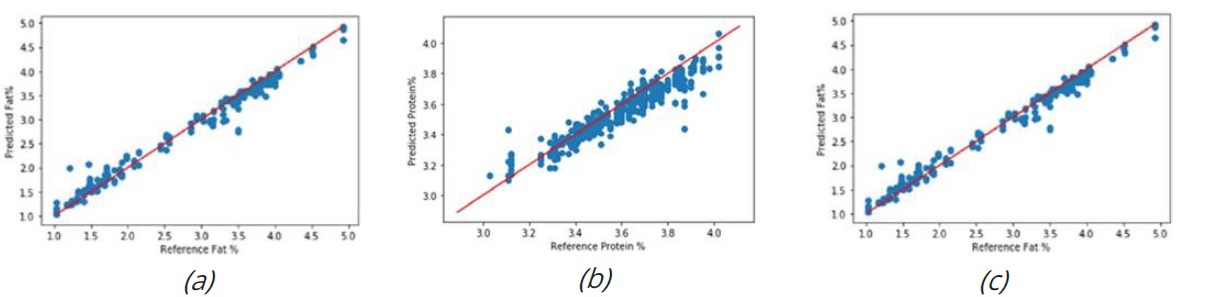
To assess the performance of the Partial Least Squares (PLS) model, a cross-validation technique was employed. This involved calculating the prediction error (root mean square of errors for all samples) and the coefficient of determination (R2CV) between predicted contents and the reference data obtained from chemical analysis. The cross-validation technique entails dividing the data into calibration and validation sets. The calibration set is utilized for training the PLS model, while the validation set is reserved for evaluating the model's performance.
In each iteration, the validation and calibration sets are combined, and a new portion of data is designated as the validation set. The process is then repeated, involving model training and validation on the updated sets. This iterative procedure continues until each sample has been represented at least once in the validation set, thereby providing a comprehensive assessment of the PLS model's predictive capabilities.
Results from the cross validation are shown in Figure 2.
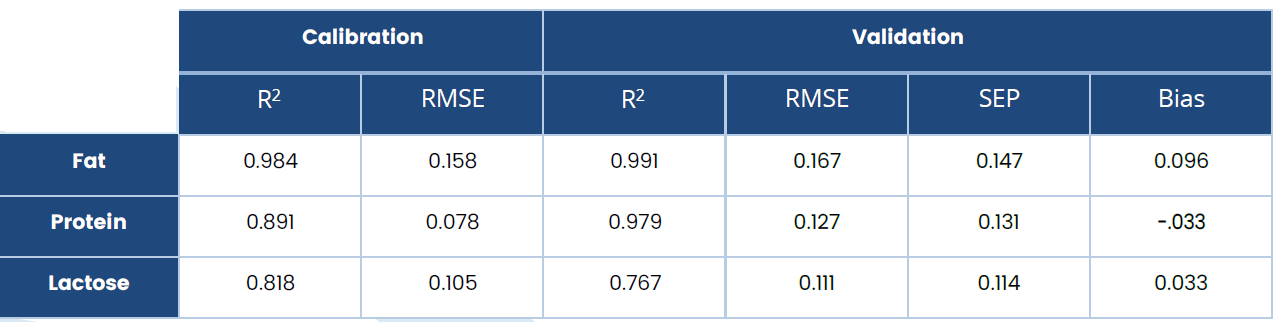
In order to quantify the accuracy of the model, the following statistical characteristics are summarized in:
• R2: Determination coefficient. The closer to 1 the better.
• RMSE: Root Mean Square of the Error. The smaller the better.
• SEP – Standard Error of prediction. The smaller the better.
• Bias – mean difference between laboratory results and predicted values. The closer to 0 the better.
The findings presented in this study suggest that the NeoSpectra Scanner holds the potential to emerge as the primary commercial solution for milk analysis, aligning with ICAR standards for in-farm applications. Simultaneously, it has the capacity to democratize the adoption of milk analysis through out the entire milk supply chain. Unlike other traditional and emerging technologies for milk analysis, NeoSpectra uniquely integrates a set of features, enabling cost-effective, rapid, widespread, user-friendly, and precise milk analysis.
Conclusions
The NeoSpectra Scanner has demonstrated excellent performance in analyzing raw milk, enabling on-field testing. Samples collected directly from the farm can be promptly analyzed, and the resulting data can be utilized to tailor and assess the health of cows and the quality of the milk. All the information is securely stored in the cloud, ensuring accessibility from any where in the world. This capability is applicable to both small-scale farmers and large corporations, offering a versatile solution that seamlessly integrates into various farm setups.

