You’ve reached a page that was previously hosted by Si-Ware Systems.
NeoSpectra Moved from
Si-Ware Systems to BUCHI

As of May 2025, NeoSpectra has officially become part of BUCHI a global leader in laboratory and process technologies.
You can continue exploring Si-Ware Systems’ sensing innovations & offerings or learn more about NeoSpectra at its new home.
What That Means

NeoSpectra has joined BUCHI
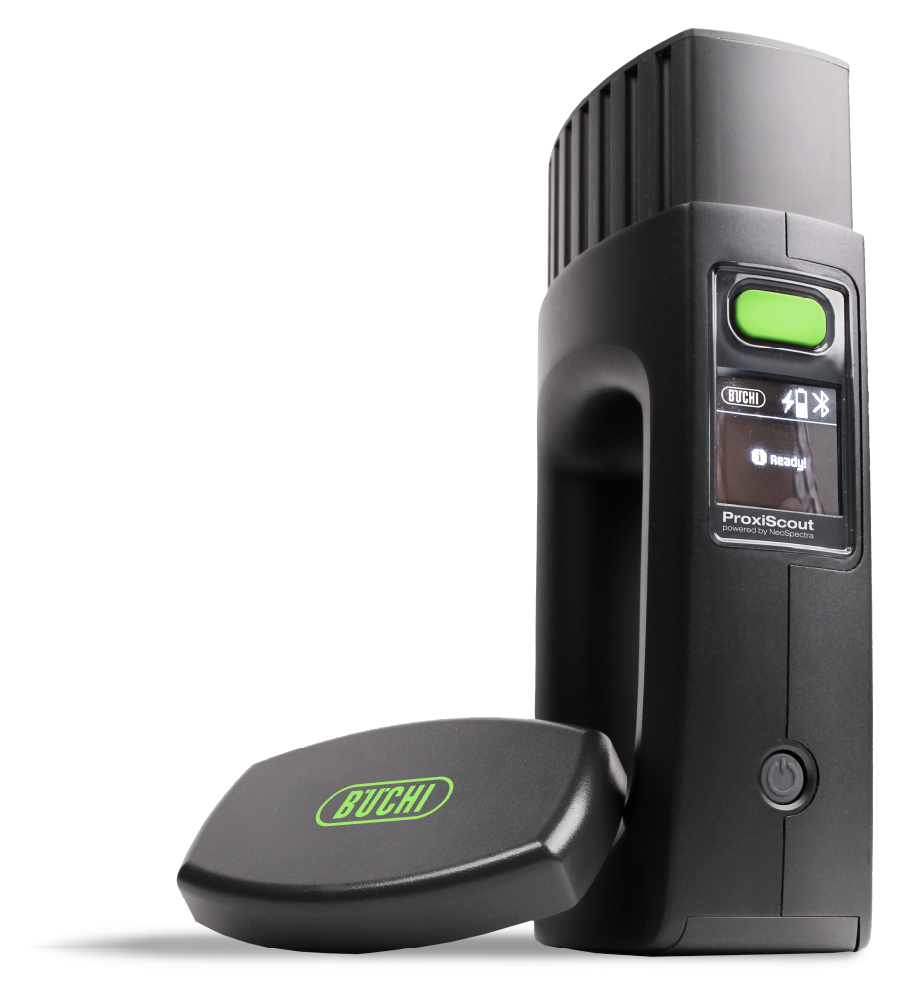
The full product line including the handheld NIR analyzer and Cloud Portal are now owned by BUCHI.
BUCHI is now your go-to for NeoSpectra
Whether you're a current customer or exploring in-field NIR solutions, you’ll find what you need on BUCHI’s website.
Si-Ware Systems continues to innovate
Si-Ware Systems is moving forward with groundbreaking sensing solutions in other markets and applications.
Where Would You Like to Go?

Explore
Si-Ware Systems
Discover our advanced sensing technologies—from MEMS-based sensors to full-stack sensing solutions—designed for OEMs and innovators across industries.

Continue to
NeoSpectra at BUCHI
Explore the next chapter for NeoSpectra under BUCHI, including handheld and inline NIR analyzers, cloud portal, and LabStore.
FAQs
What happened to NeoSpectra?

Why did Si-Ware Systems transfer NeoSpectra to BUCHI?
What is Si-Ware Systems focusing on now?
I was evaluating NeoSpectra for my company. Should I still consider it?
